IELTS Academic Writing Task 1: A Step-by-Step Report Guide
ASHYQ Team · Published Sep 24 · Updated Sep 26
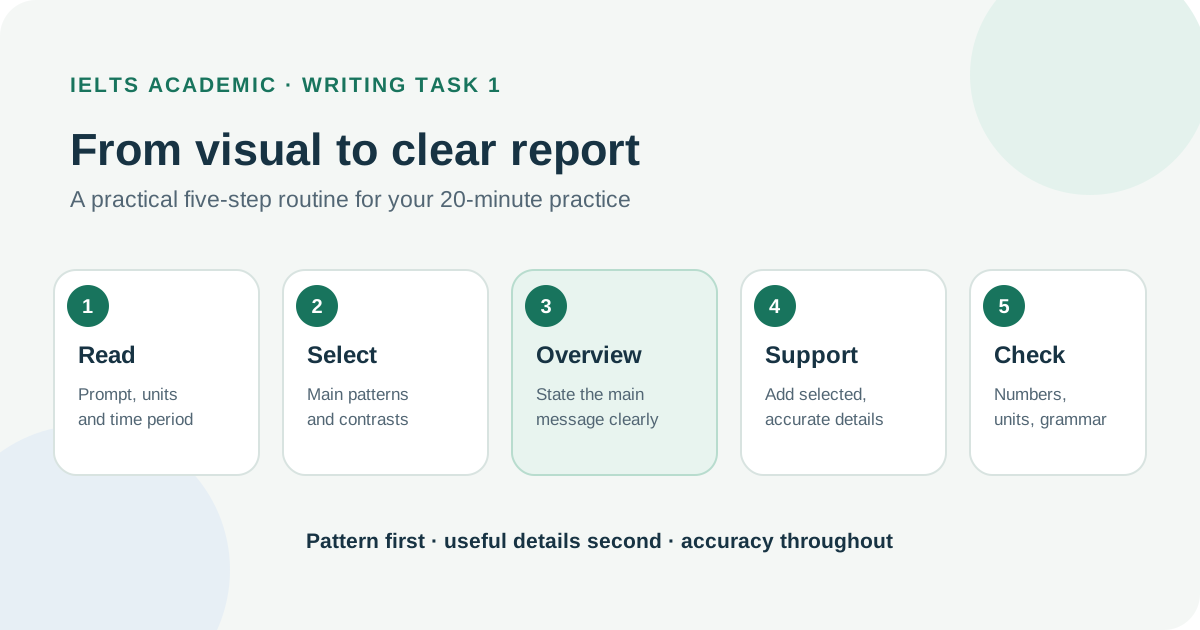
For IELTS Academic Writing Task 1, describe the main features of the visual, give a clear overview, and support it with a few accurate details. You have about 20 minutes and must write at least 150 words. A four-paragraph layout can help, but IELTS does not require an exact number of paragraphs or a fixed place for the overview. IELTS's official Academic Writing format sets the task requirements.
IELTS Academic Writing Task 1: check which test type you have
This guide covers IELTS Academic Writing Task 1: you may need to report information from a graph, chart, table, map, process or object. The General Training test has a different Task 1: a letter. Check the test type you are taking before you practise.
Task 1 is part of a 60-minute Writing test. IELTS recommends spending no more than 20 minutes on it, writing at least 150 words, and using connected prose rather than notes or bullet points. Task 2 carries twice the weight of Task 1 in the Writing score, so protect enough time for the essay as well. These are official test requirements, not a promise that a particular word count or template will earn a particular band.
A reliable method for any Academic Task 1 visual
1. Read the task and inspect the visual
Before writing, identify what is shown, who or what is being compared, the units, and the time period. Read the instruction line too: it may ask you to describe a process or explain how something works rather than compare values.
Ask yourself:
- What is being measured or illustrated?
- Which categories, stages, places or dates appear?
- Are values shown as percentages, totals, years, or another unit?
- Is the data about the past, the present, or a future estimate?
Use only information supported by the visual. IELTS describes Task 1 as a factual information-transfer task; the official assessment guidance advises candidates to select key features and compare or contrast relevant information. Do not add a cause, opinion or prediction that the task does not provide. See the IELTS Writing key assessment criteria.
2. Select the main features
Do not try to report every point. Look for the features that help a reader understand the whole visual: an overall rise or fall, a high or low point, a major contrast, a stable period, a change in stages, or a clear similarity.
For a chart with several series, compare groups that share a meaningful pattern. For a process, identify its start and end and group related stages. For a map, note the largest changes in layout or land use. The right selection depends on the visual; there is no single list of features that fits every task.
3. Write the overview before the detail
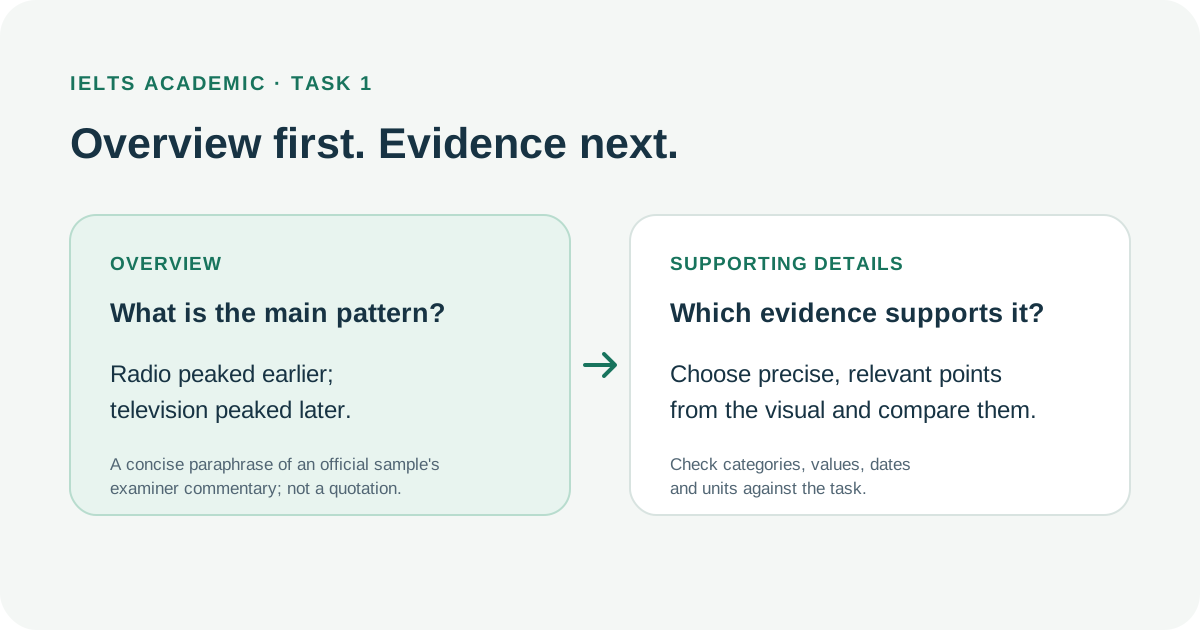
The overview gives the reader the main pattern without listing all the figures. It is usually one or two sentences. Make it specific enough to distinguish this visual from another one: mention the dominant trend, the strongest contrast, the main stages or the broad direction of change.
The official IELTS band descriptors for Academic Task 1 refer to a clear overview and appropriately selected, grouped key features at Band 7. That is why an overview should do more than say “there were several changes.” Read the official Writing band descriptors for the wording across bands.
An official IELTS sample task shows radio and television audiences across the day in 1992. In its examiner commentary, the Band 6 response is described as needing a fuller overview; the commentary points to the contrast between radio's morning peak and television's evening peak. A concise paraphrase of that pattern could be: “Overall, radio listening was strongest earlier in the day, while television viewing peaked in the evening.” This paraphrase summarizes the examiner's explanation; it is not a quotation or a new score claim. The sample scripts and comments are in the official IELTS Academic Writing sample tasks PDF.
Do not treat the example sentence as a template to reuse. Your overview must come from the visual in front of you.
4. Support the overview with accurate details
After the overview, choose a small number of details that demonstrate the pattern. Include precise values when they help, and keep units and categories clear. Comparisons are often more useful than a list: explain how two groups differ, how a figure changes over time, or which stages happen before and after another.
Check each number against the visual as you write. A correctly described trend with one inaccurate figure can confuse the reader. If the chart has many data points, select the most useful ones rather than copying the entire chart into prose.
5. Check language against the visual
Use tense that matches the dates and use comparative language only where a comparison is visible. For a process diagram, sequence words can clarify stages. For a map, use location language carefully. Do not describe a projected value as a confirmed future result: report it as a forecast or estimate if the visual labels it that way.
Useful language comes from the task itself. Identify the exact nouns, units and labels first, then choose verbs and comparisons that describe them accurately. A plain, correct description is more useful than a memorised phrase that changes the meaning.
A practical 20-minute practice plan
IELTS gives about 20 minutes for Task 1. This split is a practice suggestion, not an official timing rule; adjust it to your pace while keeping time for both tasks in the full test.
| Practice time | What to do |
|---|---|
| 2–3 minutes | Read the prompt, labels, units and dates. |
| 3–4 minutes | Choose the main features and write a one-sentence overview plan. |
| 10–12 minutes | Draft the report, grouping related details. |
| 2–3 minutes | Check coverage, comparisons, numbers, units and grammar. |
The target is a complete, readable report. Do not spend most of the time searching for “advanced” vocabulary while the overview is still missing.
Common Task 1 problems to fix
- Listing every value: group data around meaningful comparisons and trends.
- Leaving out the overview: give the reader the main pattern before the supporting detail.
- Writing an overview that says almost nothing: name the specific contrast, trend or process visible in the task.
- Adding a reason that the chart does not show: describe the information; do not invent a cause.
- Mixing up units or dates: check labels while drafting, especially when the visual contains several series.
- Using a memorised report: adapt your structure and language to the task in front of you.
- Spending too long on Task 1: practise with a timer so Task 2 still has enough space in the 60-minute test.
Final check before you move to Task 2
- Did I describe the right visual and cover its main features?
- Is the overview clear and consistent with the information shown?
- Did I choose details that support the overview?
- Are comparisons, units, dates and numbers accurate?
- Did I avoid unsupported explanations or opinions?
- Is the report at least 150 words and written in connected prose?
- Have I kept enough of the 60-minute Writing test for Task 2?
Frequently asked questions
How many words do I need for IELTS Academic Writing Task 1?
Write at least 150 words. The official format page states this minimum; it does not say that writing far beyond the minimum automatically improves a score. Use your time to select and explain relevant features clearly.
How much time should I spend on Task 1?
IELTS advises spending about 20 minutes, and Task 1 should take no more than that. Task 2 is worth twice as much in the Writing score, so practise completing Task 1 efficiently within the full 60-minute test.
Does Task 1 have to be exactly four paragraphs?
No official rule sets an exact paragraph count. A useful practice structure is an introduction, an overview and one or two detail paragraphs, but organize the report to suit the visual and keep the main features easy to follow.
Where should I put the overview?
Put it where the reader can find the main pattern easily; many candidates place it after the introduction. IELTS assesses whether the overview is clear and the key features are selected and grouped, rather than requiring one fixed position.
Can I explain why a trend happened?
Only if the visual or task provides that explanation. Task 1 asks you to report the information shown, so adding an unsupported cause or personal opinion may take the response away from the task.
Continue your IELTS preparation
ASHYQ is a Kazakhstan-based education brand offering online IELTS and Digital SAT preparation. If you are working on Academic Writing, you can explore the online IELTS course in Kazakhstan and its preparation format. For a broader level check, use the ASHYQ diagnostic; it is an initial orientation and does not assign an official IELTS Writing band or assess this specific Task 1 report.
If you are also preparing for the essay, read our Russian-language guide to IELTS Writing Task 2 planning and assessment.